| PANDEMIC ALERT LEVEL |
| 123456 |
| Tracking the next pandemic: Avian Flu Talk |
Swine flu cases overestimated? |
Post Reply 
|
| Author | |
dennis2 
Valued Member 
Original Join Date: Long Term Member Joined: July 31 2007 Status: Offline Points: 267 |
 Post Options Post Options
") Thanks(0) Thanks(0)
 Quote Reply Quote Reply
 Topic: Swine flu cases overestimated? Topic: Swine flu cases overestimated?Posted: October 27 2009 at 7:07am |
|
From CBS report-
If you've been diagnosed "probable" or "presumed" 2009 H1N1 or "swine flu" in recent months, you may be surprised to know this: odds are you didn't have H1N1 flu.
In fact, you probably didn't have flu at all........ CBS News learned that the decision to stop counting H1N1 flu cases was made so hastily that states weren't given the opportunity to provide input. Instead, on July 24, the Council for State and Territorial Epidemiologists, CSTE, issued the following notice to state public health officials on behalf of the CDC: "Attached are the Q&As that will be posted on the CDC website tomorrow explaining why CDC is no longer reporting case counts for novel H1N1. CDC would have liked to have run these by you for input but unfortunately there was not enough time before these needed to be posted (emphasis added)." ....... |
|
|
after all is said and done- more is said than done
|
|
 |
|
|
Technologist
Admin Group 

Joined: May 05 2009 Location: California Status: Offline Points: 1192 |
Post Options
Thanks(0)
Quote Reply
Posted: October 27 2009 at 7:34am |
This death chart was on the first link. What's wrong with it? 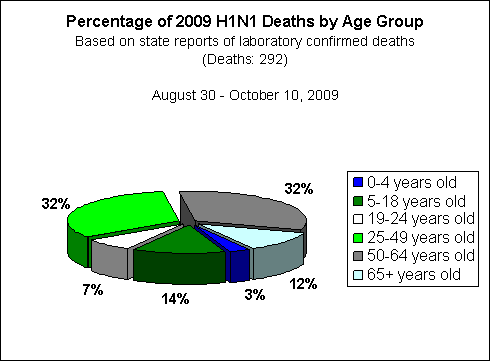
They made this pie chart with large and small chunks depending on your are group but if you break the ages down you will see they are more balanced. 0-4 = (4 years ) and 3% deaths 5-18 = (13 years) and 14% deaths 19-24= (5 years ) and 7% deaths 25-49= (24 years) and 32% deaths 50-64= (14 years) and 32% deaths 65+ = (15 years) and 12% deaths Those numbers look different then the pie chart suggests. Also 90% of all deaths to the seasonal flu are over 65 compared to 12% for the swine flu. So is this swine flu really targeting the young or are the 19-64 age group the most likely to die? The 292 death sampling is pretty small. |
|
|
|
|
pitselp
Valued Member
Joined: March 24 2006 Status: Offline Points: 6 |
Post Options
Thanks(0)
Quote Reply
Posted: October 27 2009 at 9:39am |
|
One way to make whatever point you are advocating is to construct a chart that is misleading - all sorts of ways to do this, including this one where the age groupings are not equal. As pointed out by Technologist (good catch), one could present a very different picture, perhaps, if you grouped death by ages in 10 year intervals, for example.
Pat |
|
|
|
|
4=laro
Valued Member
Joined: April 18 2007 Status: Offline Points: 731 |
Post Options
Thanks(0)
Quote Reply
Posted: October 27 2009 at 2:01pm |
|
If they do not test for the flu and no one is counting, then an estimate is worthless since it is based on unavailable numbers. Anyone can make up any numbers they want. Forinstance, if the president got the flu, we could conclude that 100% of the presidents get H1N1, however, that could be completely faulse because he might only have a cold or he might have seasonal flu so since he isnt tested - all we have is a guess. With this in mind, all estimates and all suppsed counts should be ignored.
|
|
|
|
|
Medclinician
V.I.P. Member

Valued Member Since 2006 Joined: July 08 2009 Status: Offline Points: 23322 |
Post Options
Thanks(0)
Quote Reply
Posted: October 27 2009 at 4:07pm |
|
IMHO
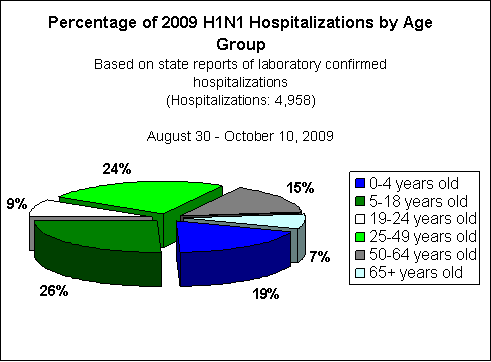
Cases in the U.S. based on fairly simple algorithms are likely at least in the tens of millions based on a CDC algorithm used for the May surge which was likely under actual cases in the general populaton. This stated there were more than 1 million cases in the U.S. We are estimating from 30%-40% infection paralleling at least a modest flu season with a high of maybe 70%. The CFR rate is still difficult to determine because while it may be 5% in influenza testing spread out to a much larger number of uncounted and unreported in the different population this would causes a substantial drop. At this point it is literally impossible to determined if that drop could even be as low as .1% CFR when taking into account an infection rate in the U.S. of 40%. Also, characteristically a child death is a high press item and the average age according to some studies... IMHO October 20, 2009 1:00 PM ET The percentage of hospitalizations for 2009 H1N1 flu in the United States varies by age group. From August 30, 2009 through October 10, 2009, states reported 4,958 laboratory-confirmed 2009 H1N1 hospitalizations to CDC. The percentage of 2009 H1N1 related hospitalizations that occurred among those 0 to 4 years old was 19%; among those 5 years to 18 years was 25%; among people 19 years to 24 years was 9%; among those 25 years to 49 years was 24%; among people 50 to 64 years was 15%; and among people 65 years and older was 7%. For a graphical representation of this data, please see the chart below.
What percentage of deaths for 2009 H1N1 flu occur in different age groups in the United States? The percentage of deaths for 2009 H1N1 flu in the United States varies by age group. From August 30, 2009 through October 10, 2009, states reported 292 laboratory-confirmed 2009 H1N1 deaths to CDC. The percentage of 2009 H1N1 related deaths that occurred among people 0 years to 4 years was 3%; among those 5 years to 18 years was 14%; among people 19 to 24 years was 7%; among people 25 to 49 years was 33%; among people 50-64 years was 32%; and among people 65 years and older was 12%. For a graphical representation of this data, please see the chart below.
http://www.cdc.gov/H1N1flu/qa.htm Med |
|
|
|
|
Post Reply
|
|
 Tweet
Tweet
|
| Forum Jump | Forum Permissions You cannot post new topics in this forum You cannot reply to topics in this forum You cannot delete your posts in this forum You cannot edit your posts in this forum You cannot create polls in this forum You can vote in polls in this forum |


 Topic Options
 dennis2 wrote: