| PANDEMIC ALERT LEVEL |
| 123456 |
| Tracking the next pandemic: Avian Flu Talk |
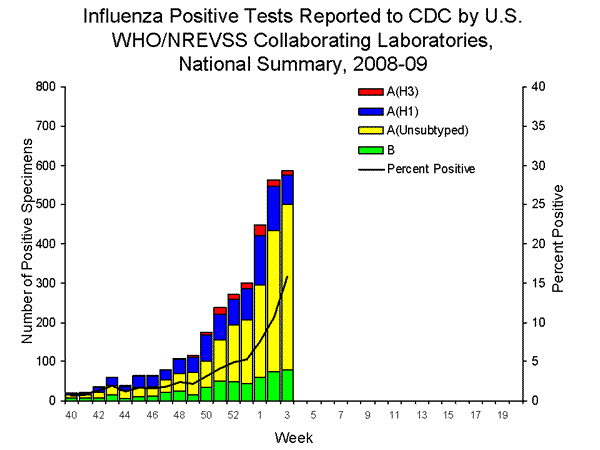
30% Influenza Test Positive U.S.A Flu- CDC - |
Post Reply 
|
| Author | |
Guests 
Guest Group 
|
 Post Options Post Options
") Thanks(0) Thanks(0)
 Quote Reply Quote Reply
 Topic: 30% Influenza Test Positive U.S.A Flu- CDC - Topic: 30% Influenza Test Positive U.S.A Flu- CDC -Posted: January 31 2009 at 10:32am |
|
|
 |
|
|
Guests
Guest Group
|
Post Options
Thanks(0)
Quote Reply
Posted: January 31 2009 at 3:10pm |
|
For the above season...
During September 28–November 29, 2008, the United States experienced a low level of influenza activity which is typical for this time of year and similar to the past four influenza seasons. The peak of influenza activity has come before January in only five of the past 20 seasons; February or March has been the peak month in 11 of those 20 seasons (CDC, unpublished data, 2008). ... providers should offer influenza vaccine throughout the influenza season (which can persist as late as April or May) to protect as many persons from influenza infection and its complications as possible.
to compare to last season... 2007-2008
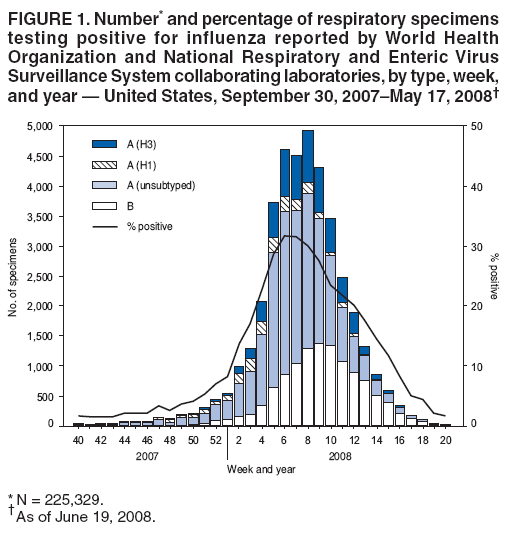 During September 30, 2007--May 17, 2008,** World Health Organization and National Respiratory and Enteric Virus Surveillance System collaborating
laboratories in the United States tested 225,329 specimens for influenza viruses; 39,827 (18%) were positive (Figure 1).
Of the positive specimens, 28,263 (71%) were influenza A viruses, and 11,564 (29%) were influenza B viruses. Among the influenza A viruses, 8,290 (29%) were subtyped; 2,175
(26%) were influenza A (H1N1), and 6,115 (74%) were influenza A (H3N2) viruses.
The proportion of specimens testing positive for influenza first exceeded 10% during the week ending January 12, 2008 (week 2), peaked at 32% during the week ending February 9, 2008 (week 6), and declined to <10% during the week ending April 19, 2008 (week 16). The proportion positive was above 10% for 14 consecutive weeks. The peak percentage of specimens testing positive for influenza during the previous three seasons ranged from 22% to 34% and the peak occurred during mid-February to early March (1). During the previous three influenza seasons, the number of consecutive weeks during which more than 10% of specimens tested positive for influenza ranged from 13 to 17 weeks (1).
|
|
|
|
|
Post Reply
|
|
 Tweet
Tweet
|
| Forum Jump | Forum Permissions You cannot post new topics in this forum You cannot reply to topics in this forum You cannot delete your posts in this forum You cannot edit your posts in this forum You cannot create polls in this forum You can vote in polls in this forum |


 Topic Options